



Urban areas account for only 16.7% of land, yet 9 in 10 citizens reside in cities
Aug 20, 2026, 10:45 am


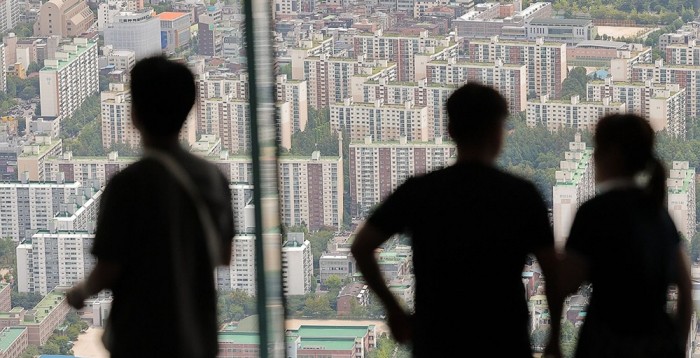 |
| A view of downtown Seoul residential complexes seen from Seoul Sky at Lotte World Tower in Songpa-gu, Seoul. / Yonhap News |
A total of 92.1 percent of the national population was found to reside in urban areas, which account for a mere 16.7 percent of the total land area. While the land areas of residential, commercial, and industrial zones have increased since 2021, green zones saw a slight decline. Development activity permits have shown a downward trend over the past five years, and long-term unexecuted urban and county planning facilities were also surveyed to have steadily decreased.
The Ministry of Land, Infrastructure and Transport and the Korea Land and Geospatial Informatix Corporation announced the "2025 Urban Planning Status Statistics" containing these details on August 20. The Urban Planning Status Statistics are state-approved statistics compiled annually on zoning districts, development activity permits, and urban and county planning facilities managed by local governments.
According to the statistics, total land area designated into zoning districts stood at 106,563 square kilometers as of the end of last year. Among this, urban areas covered 17,740 square kilometers, making up 16.7 percent of the entire national territory. Out of a total registered resident population of 51.12 million, 47.06 million people (92.1 percent) lived in urban areas.
By zoning district, agricultural and forestry areas were the largest at 49,191 square kilometers (46.2 percent). This was followed by management areas at 27,329 square kilometers (25.6 percent), urban areas at 17,740 square kilometers (16.7 percent), and natural environment conservation areas at 11,874 square kilometers (11.1 percent).
Within urban areas, green zones accounted for the largest share at 12,555 square kilometers (70.8 percent). Residential zones covered 2,791 square kilometers (15.7 percent), industrial zones 1,292 square kilometers (7.3 percent), and commercial zones 349 square kilometers (2.0 percent).
Compared to 2021, residential zones grew by 51 square kilometers (1.9 percent), commercial zones by 7 square kilometers (2.0 percent), and industrial zones by 51 square kilometers (4.1 percent). In contrast, green zones decreased by 37 square kilometers (0.3 percent). Outside urban areas, management areas dropped by 30 square kilometers (0.1 percent) and agricultural and forestry areas shrank by 10 square kilometers (0.02 percent), whereas natural environment conservation areas grew by 13 square kilometers (0.1 percent).
Growth management planning zones, introduced to curb disorderly development in non-urbanized areas, continued an upward trajectory. Last year, growth management planning zones totaled 13,801 sites, spanning an area of 4,692 square kilometers. In particular, designated areas expanded significantly as establishing a growth management plan became mandatory starting in January 2024 to install factories in planned management areas.
Development activity permits showed a declining trend. Last year, development activity permits numbered 169,319 cases. Building construction accounted for the largest share at 84,618 cases (50.0 percent), followed by land form and quality alterations at 47,938 cases (28.3 percent) and structure installations at 24,418 cases (14.4 percent).
Urban and county planning facilities stood at 369,000 sites across an area of 7,237 square kilometers. By facility type, transportation facilities such as roads and railways covered the largest area at 2,319 square kilometers (32.0 percent), followed by disaster prevention facilities such as rivers and retarding basins at 2,294 square kilometers (31.7 percent), and spatial facilities such as parks, green spaces, and plazas at 1,171 square kilometers (16.2 percent).
Unexecuted facilities, which were designated as urban and county planning facilities but have not actually been installed, stood at 427 square kilometers, down 25 square kilometers from the previous year. This represents 5.9 percent of the total area designated for urban and county planning facilities.
In particular, long-term unexecuted urban and county planning facilities left unbuilt for over 10 years after designation fell 63.8 percent (554 square kilometers), from 869 square kilometers in 2015 to 315 square kilometers last year. Over the past five years, the trend has shown designated and executed areas of urban and county planning facilities increasing while unexecuted areas have decreased.
An official from the Ministry of Land, Infrastructure and Transport said, "The Urban Planning Status Statistics are used as foundational data for establishing national land and urban policies. Detailed statistics can be checked on Land-Ieum and Jipyyo Nuri."
Kim Da-bin
Most Read
-
1
Celltrion nears additional contract with major U.S..

-
2
Putin proposes trilateral U.S.-China-Russia summit..

-
3
U.S. weighs dropping MOAB, world's most powerful n..

-
4
"Aren't those foreigners on welfare?": M..

-
5
Attention centers on APEC for possible Trump-Xi-Pu..

-
6
Saudi Arabia, Iran hold first diplomatic talks to..

-
7
China tightens grip on boosting domestic demand an..

PEOPLE







-
Address : In-Young Bldg., 34, Uisadang-daero 1-gil, Yeongdeungpo-gu, Seoul
Copyright by ASIATODAY CO., LTD. All rights resereved